Case study
Thermodynamics of Laser‑Processed Aircraft Alloys
A graduate research paper on what happens inside titanium and nickel aircraft alloys when they are laser processed or 3D printed. I compared three thermodynamic models against published experiments, built my own analytical plots in Python, and looked at what the results mean for FAA and EASA certification.
- How far the Rosenthal model overpredicts cooling rate against published experimentsFrom my analysis of published data
- 40–55%
- Scan speed range, in m/s, giving the highest yield strength in the compiled Ti‑6Al‑4V dataFrom my analysis of published data
- 0.4–0.8
The question
Laser powder bed fusion and directed energy deposition are now used to make and repair titanium and nickel parts for aircraft and engines. The metal heats and cools at thousands to millions of degrees per second, far too fast for the equilibrium thermodynamics normally used in design. That matters for flight safety: the process locks in microstructures and residual stresses that affect fatigue life, creep resistance and distortion in parts that have to be certified.
The paper asks how well three established models explain what happens to Ti-6Al-4V and IN718 under those conditions.
Approach
- Heat transfer. I derived the Rosenthal moving heat source solution, which turns the moving laser problem into a steady one, and used it to predict how cooling rate depends on scan speed. I also covered the enthalpy method that accounts for latent heat.
- Phase transformation. I used Johnson-Mehl-Avrami-Kolmogorov kinetics to explain why printed Ti-6Al-4V always comes out fully martensitic, and how IN718 needs heat treatment after printing to form its strengthening phase.
- Residual stress. I used a thermo-elasto-plastic model to explain the tensile stresses that form near printed surfaces, and how changing the scan strategy reduces them.
My own analysis
I generated three original plots in Python to test the models against the literature:
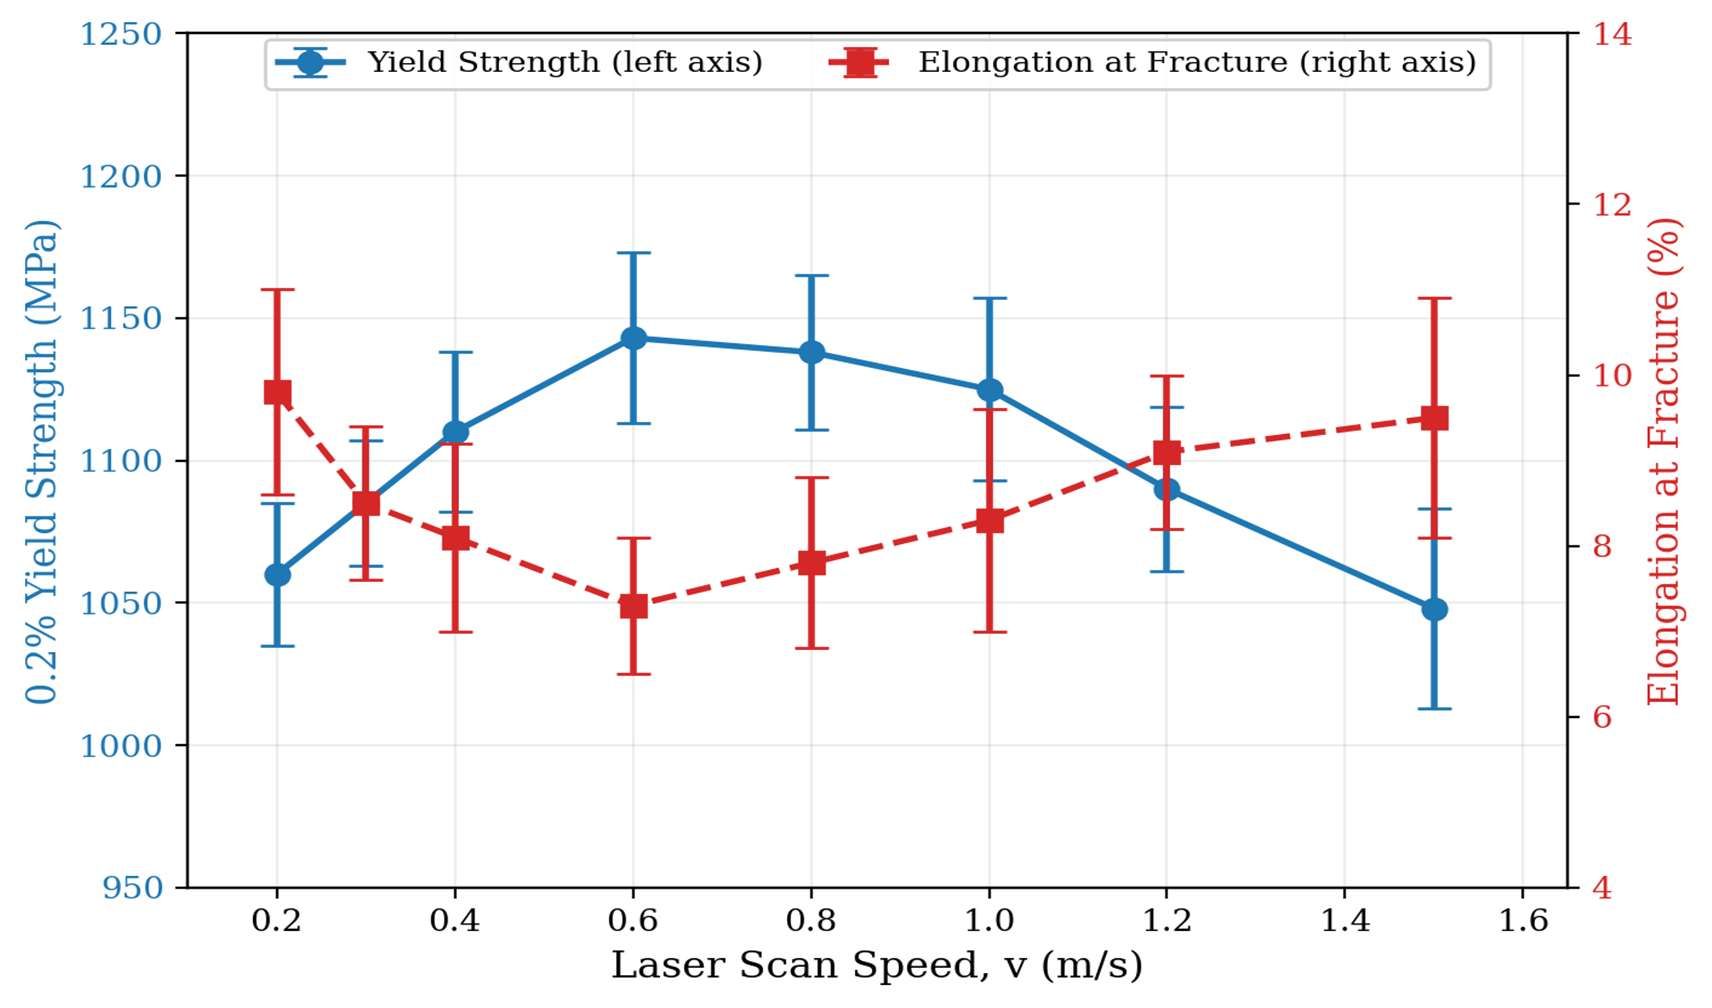
- yield strength and elongation against scan speed, compiled from five published studies;
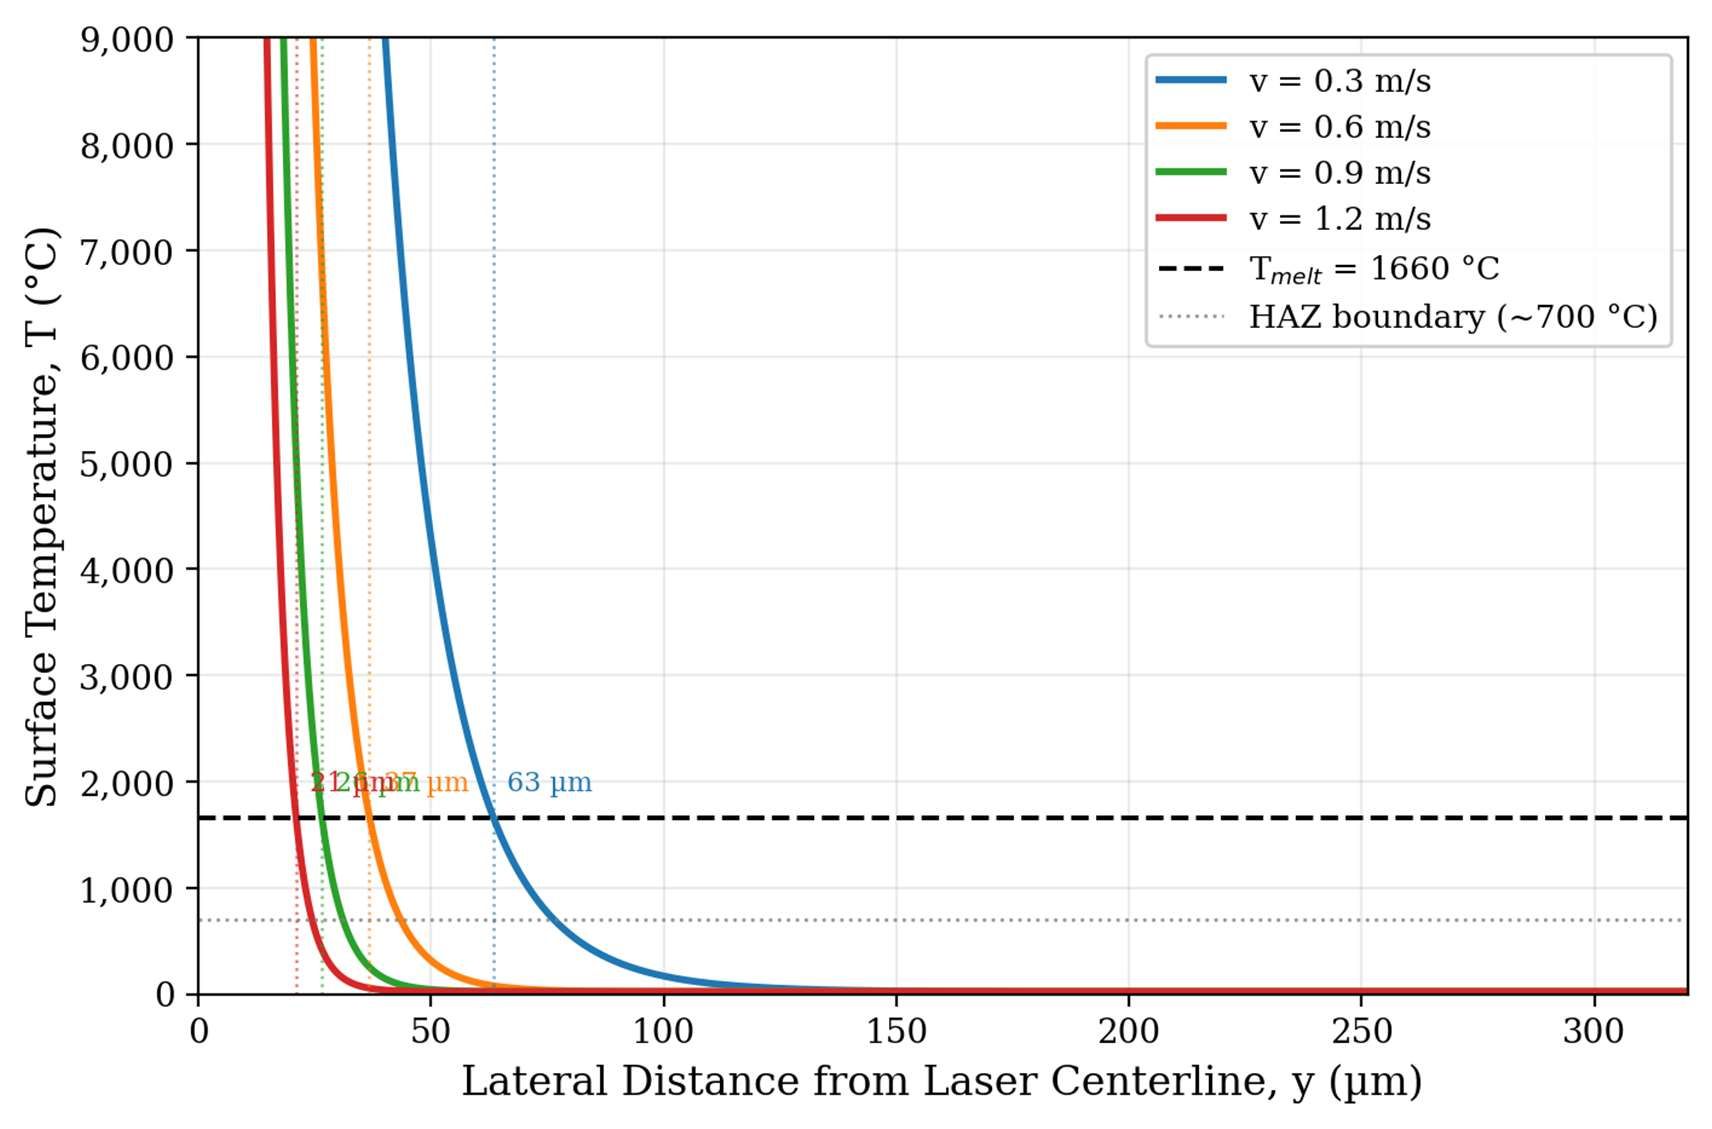
- the surface temperature profile across the melt track at four scan speeds, computed from the Rosenthal solution;
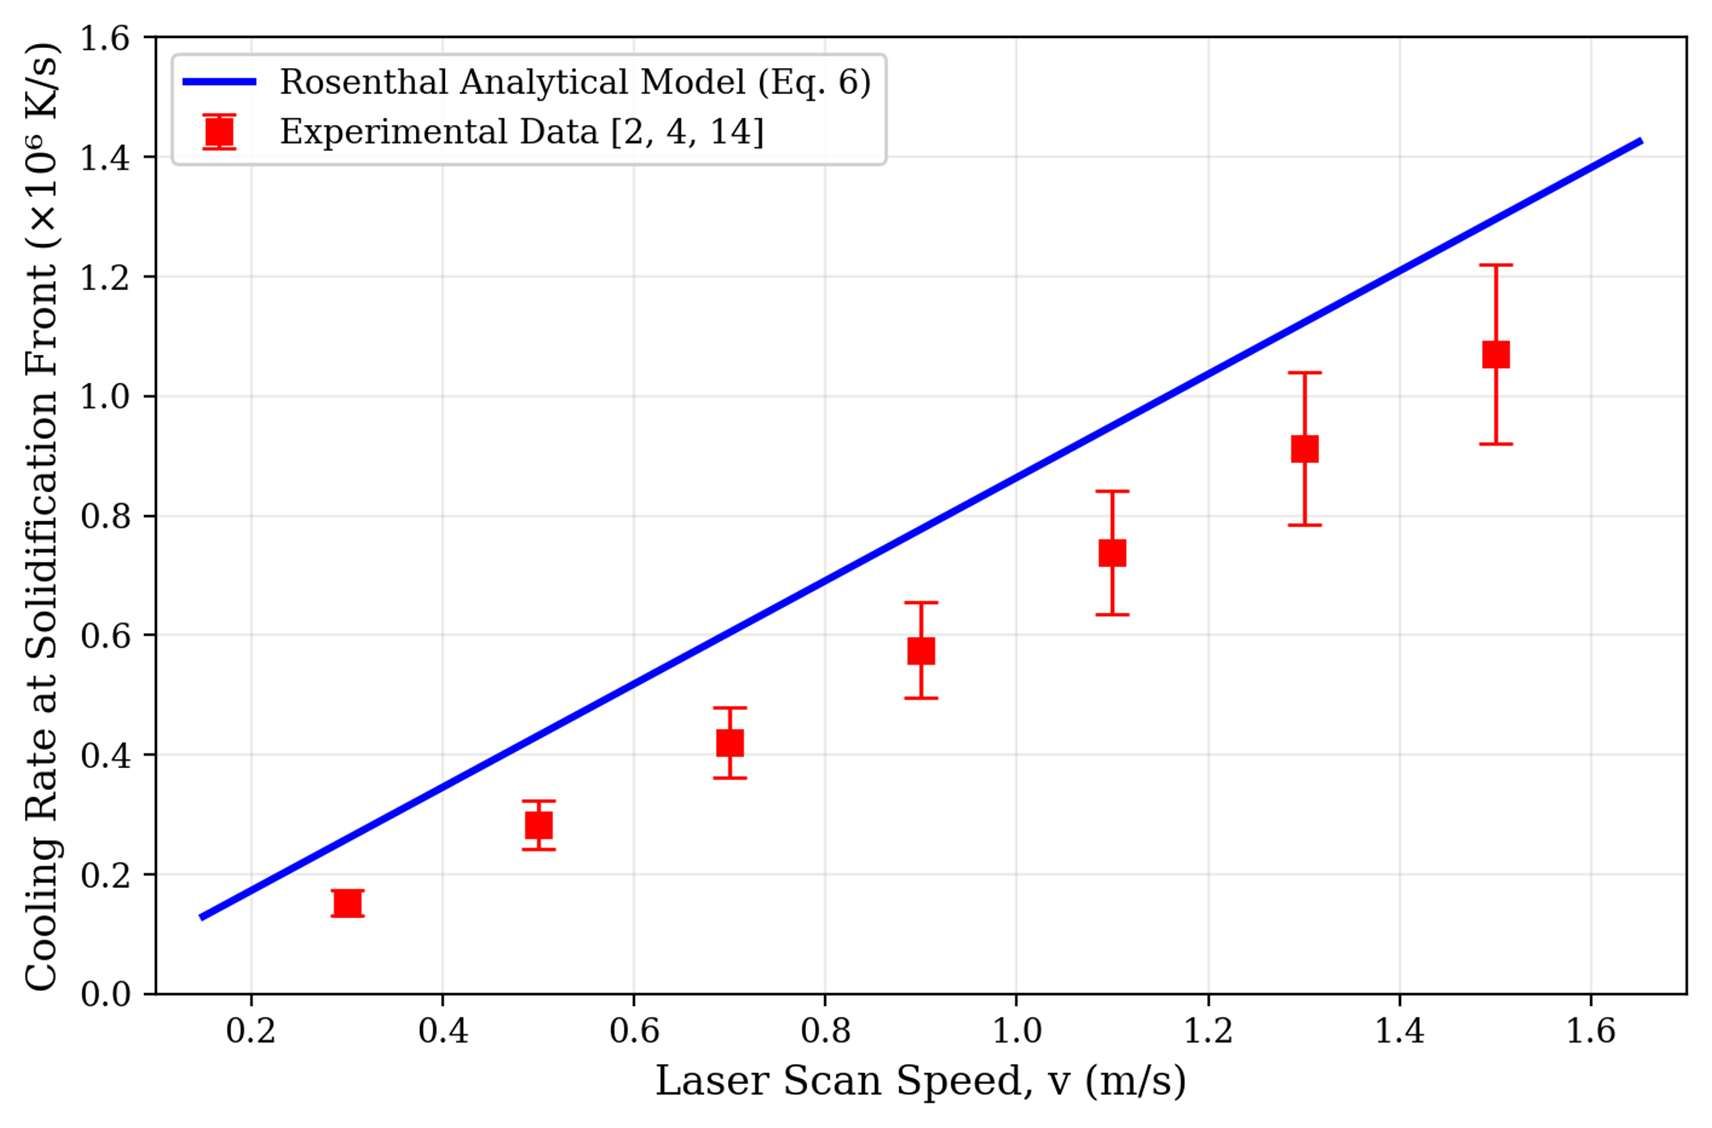
- predicted cooling rate against experimental values from three studies.
Findings
- The Rosenthal model captures the right trend, with cooling rate rising linearly with scan speed, but overpredicts it by 40–55%. The gap grows at higher speeds, which points to melt pool convection that the model leaves out.
- The compiled data shows the highest yield strength at medium scan speeds of about 0.4–0.8 m/s, where ductility is lowest. This matches the fine martensite expected at the highest cooling rates.
- Across commercial printing speeds, Ti-6Al-4V cools far faster than the rate needed to form martensite, so the as-built structure is predictable.
Why it matters for certification
The paper connects each model to FAA and EASA requirements, including FAA Advisory Circular AC 33.15-1 for additively manufactured engine parts and the fatigue rules in FAR 25.571. Simple models can narrow down which microstructures and stress states need testing, but the Rosenthal model is not yet accurate enough on melt pool size to stand in for testing at high scan speeds.
Next steps
The paper ends with the research still needed: combined flow, heat and stress simulations; faster surrogate models trained on detailed ones; and shared experimental benchmark data to validate them.