Case study · Jan – Apr 2026
Bio-Inspired Airfoil for Turbulent Flow
A research proposal to test whether humpback-whale-style bumps on a wing's leading edge, called tubercles, can increase lift, reduce drag and delay stall in the turbulent air aircraft actually fly in. Our team designed a combined CFD and wind tunnel study to find out.
The idea
Humpback whales have rows of bumps, called tubercles, along the front edge of their flippers. Studies have shown that similar bumps on a wing can create small vortices that keep air attached to the surface for longer, which can raise lift and delay stall. That makes them interesting as a passive flow control device: no moving parts and no power needed.
The gap
Almost all of that research was done in smooth, steady, low-speed flow. Real aircraft fly through turbulence, and the published results disagree on how much tubercles help with drag and efficiency. Very few studies check computer simulations against wind tunnel measurements under turbulent conditions.
What we proposed
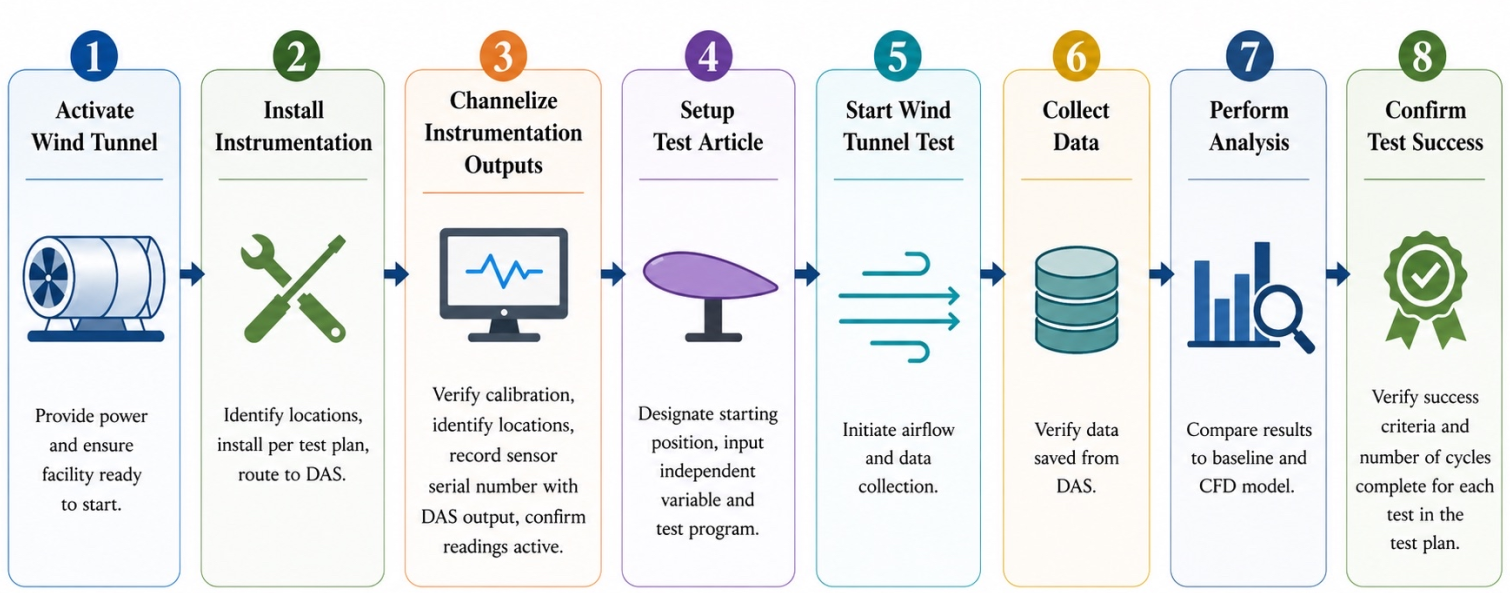
The proposal compares a smooth NACA 0012 wing with versions that have sinusoidal leading-edge tubercles, varying the bump size and spacing, the angle of attack and the flow conditions, and measuring lift, drag and stall angle.
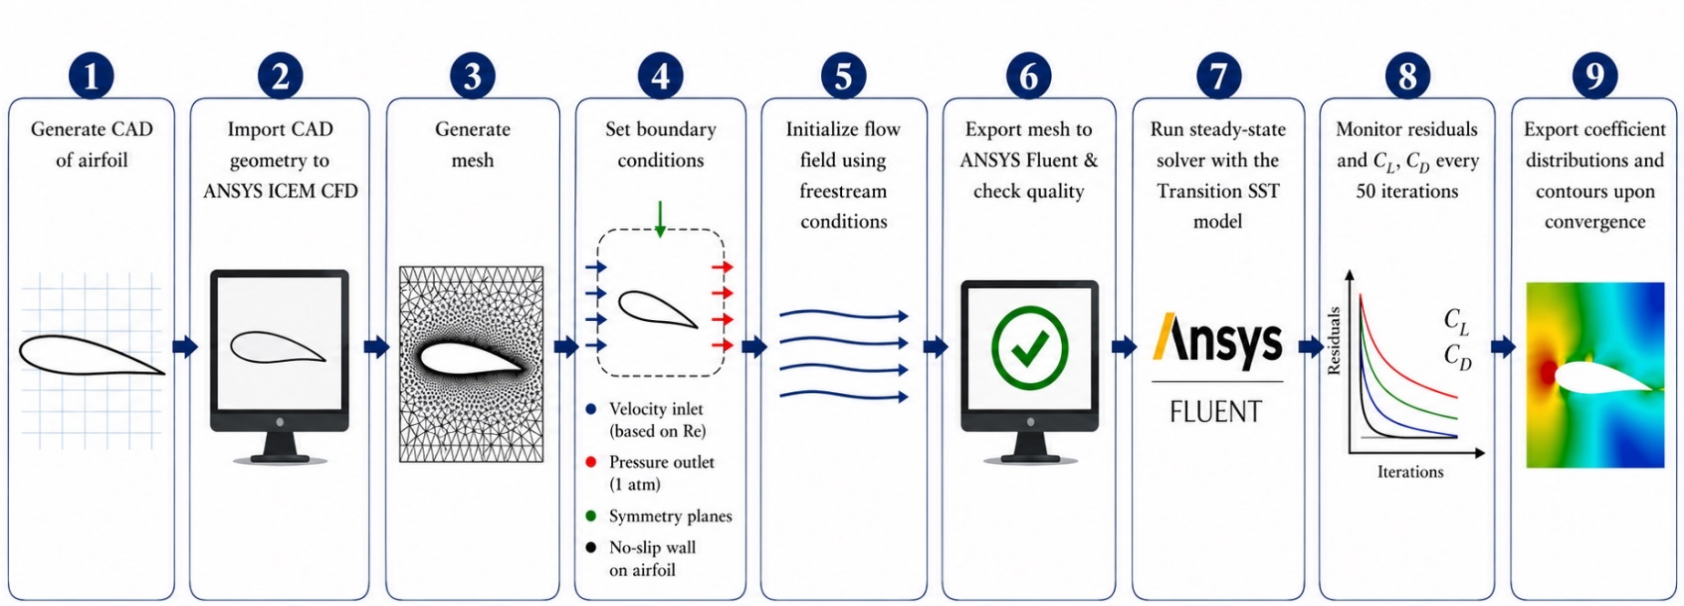
- CFD first. The wings would be modelled in SolidWorks and simulated in ANSYS Fluent, with a mesh independence study and the baseline wing checked against published data before any tubercle results are trusted.
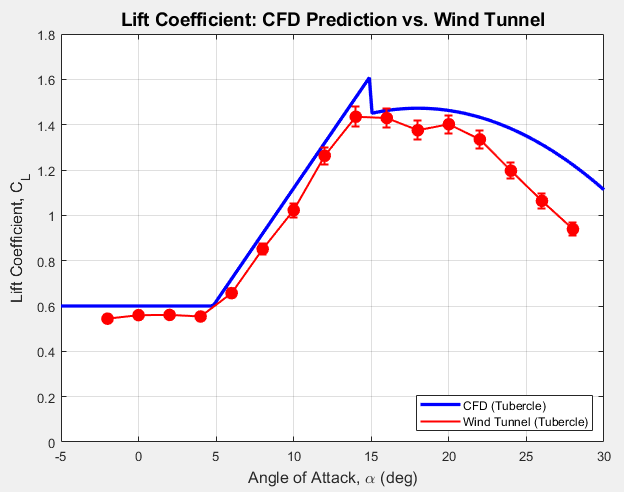
- Wind tunnel second. 3D-printed wings would be tested in a low-speed wind tunnel with a six-component force balance and pressure measurements, first in smooth flow to validate the CFD, then with screens added to create turbulence.
- Statistics. Repeated runs at each angle, uncertainty estimates, and significance testing with confidence intervals, so any improvement can be told apart from noise.
Why it matters
If tubercles hold up in turbulent air, they could make aircraft and drones more efficient and more forgiving near stall, with the same idea carrying over to wind turbine blades and propellers.
Status
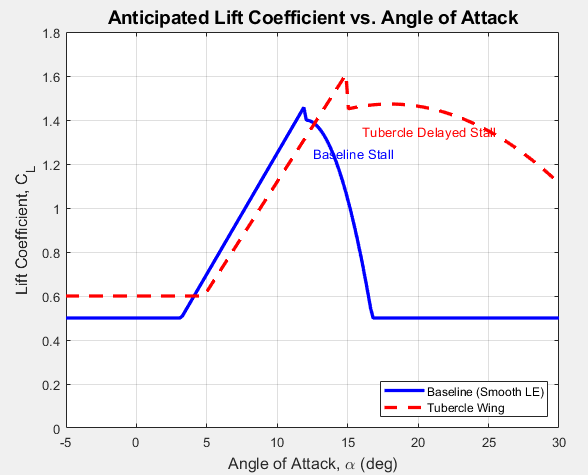
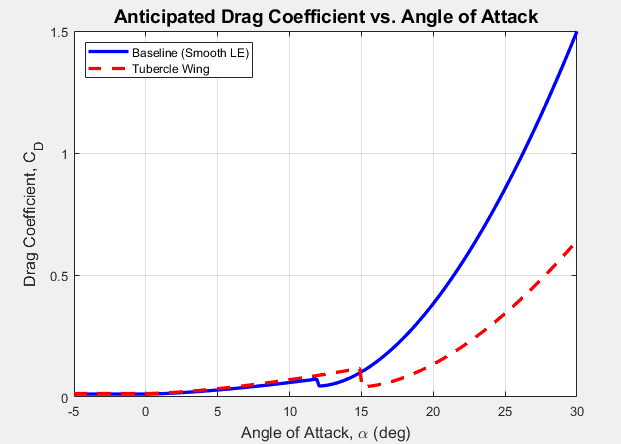
This is a research proposal. The study has not been run, so there are no measured results yet. The lift and drag charts below are the trends we expect, predicted from earlier published work: a stall delayed from about 12° to 15°, and more lift and less drag after stall.